User’s indicators
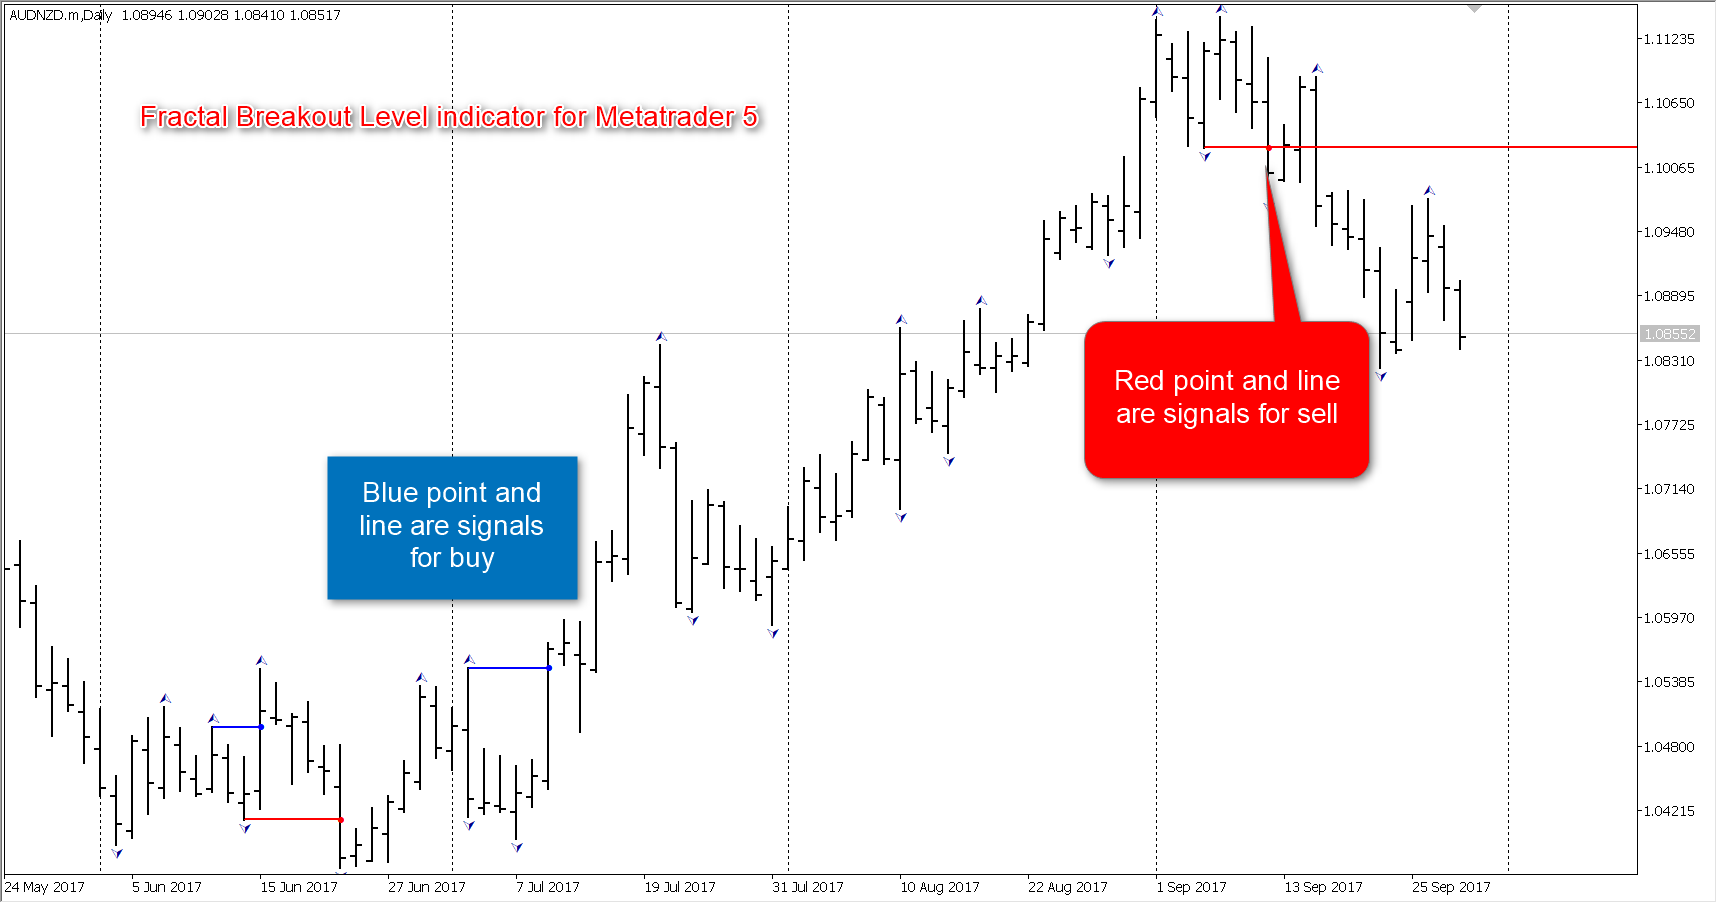
FractalBreakoutLevel – marks the “Change trend” signals on the chart. The indicator shows the trader on which direction of the market he should activate his signals. The indicator determines and marks the signal of the “first dimension of the market” – the “phase space”. By connecting the product to the chart, the trader clearly, can the bar that has broken through and closed above (below) the fractal level. On this bar, a blue or red dot is drawn. At the moment of true overcoming of a fractal for buy, the indicator draws a blue horizontal line. If a fractal is broken for sell, a red horizontal line appears on the chart. After receiving this signal, it is recommended to activate market signals from the following four “market measurements” towards the breakdown of the fractal level. See the figure.
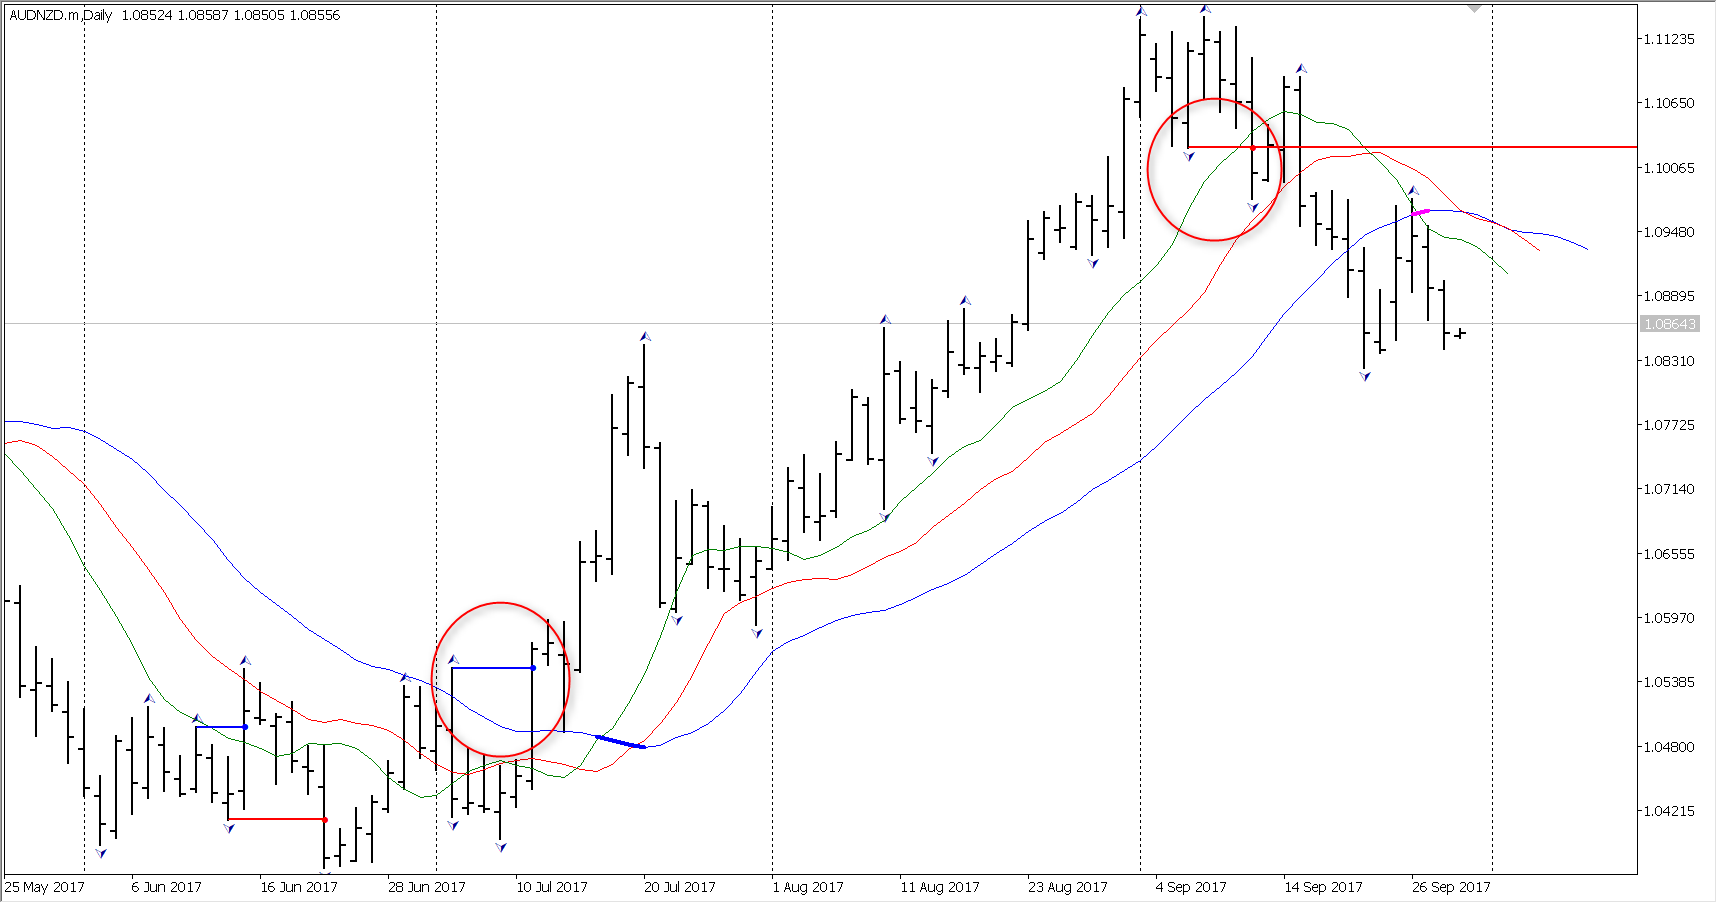
AlligatorModified is an improved Alligator indicator that determines the moments of a real intersection, rather than the interlacing of balance lines. This is clearly visible on the chart due to the appropriate marking. The main function of the indicator is to filter the “first dimension” signals – breakdowns of fractal levels. If, after the breakdown of the fractal level, the horizontal line is above the Alligator’s “Dental Line” and there was no earlier “Divergent reversal bar”, then such a fractal breakdown, as a rule, does not lead to a market start a trend. Correction of more possible. Refer to the following figure.
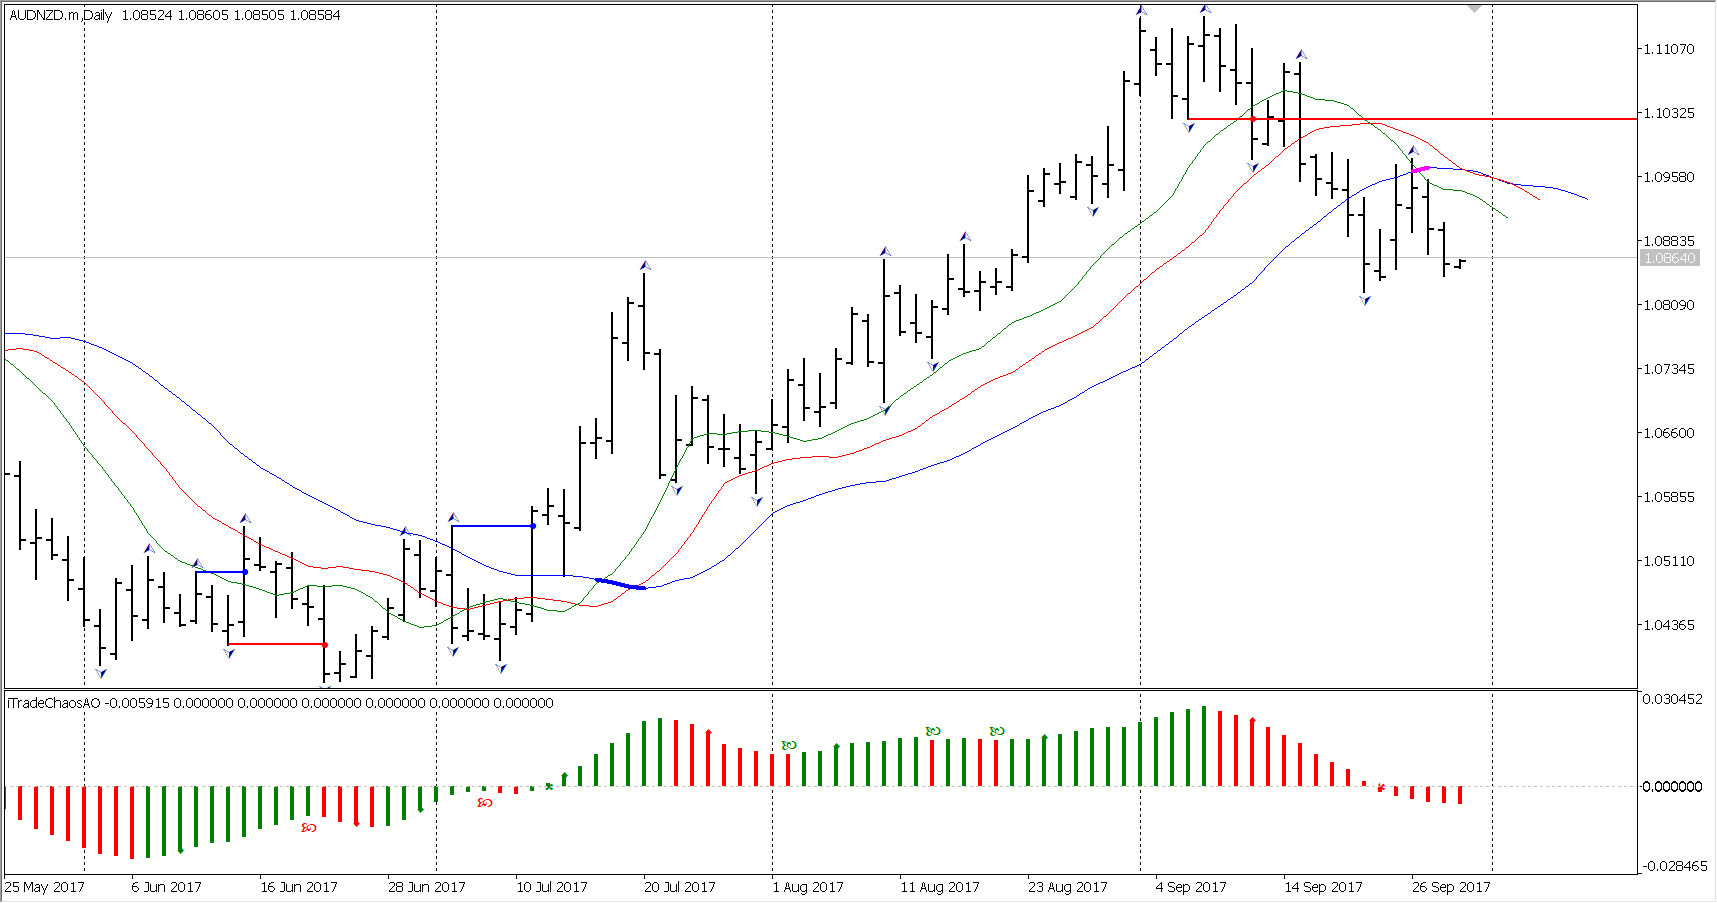
ModifiedAwesomeOscillator– indicator of the “second dimension of the market.” Upgraded “Awesome Oscillator” with applying trading signals to the histogram. If you understand the operation of this excellent indicator and its signals, you can successfully trade without even paying attention to the price dinamics. Bill Williams values the role of the Awesome Oscillator indicator so highly that it colors the bars on the chart in the color of the AO histogram, regardless of their direction and calls it the market momentum. Basic rules for using Awesome Oscillator:
- The histogram is above the zero line, the histogram is green – prices are prone to growth. Positive zone. It is recommendedto buy.
- The histogram is above the zero line, the histogram is red – prices slow their growth, move in the side. Soon, there may be a reversal of the trend direction. A reverse is especially probable, if before there was a “Two Peaks” signal and a divergence of the price.
- The histogram is below the zero line, the histogram is red – prices tend to fall. Negative zone. Sell recommendation.
- The histogram is below the zero line, the histogram is green – prices slow down, they move in the side. Soon, there may be a reversal of the trend direction into a bullish one. A reverse is especially probable, if before there was a signal “Two Peaks” and a divergence of the price.
- If each successive peak (low) of the histogram is smaller (larger) than the previous peak (cavity), you should expect a price turn.
The three basic rules for using the Awesome Oscillator (Awesome Oscillator) in calculating Elliott waves.
- To determine the peak of the 3rd wave of any order on any period. Wave 3 will have the highest peak on the AO of 100-140 bars. See the pictures with trading signals and the chart with the indicator connected.
- To determine if the minimum conditions for wave 4 are met. (Transition of the histogram through the zero line after the peak of the third wave)
- To determine whether there is a divergence between price and momentum, and to show what is now the value of the momentum of the market.
ModifiedAccleratorOscillator – marks the trading signals of the AC indicator. The panel does not define trading signals from this indicator. However, it is used in determining the most important signal of “Zonality” – “The Fourth Dimension of the Market”.
5thDimension – indicator of the “fifth dimension” of the market. It searches for “the fifth dimension” signals on the chart and marks them.
TradingChaosChart – The indicator is very similar to the product of Bill Williams in the trading platform CQG. The main functions of the indicator are: Definition and marking on the chart of SQUAT “squatting”, divergent, reversal bars. Determination of angulation, construction of angular rays from the balance lines to the “The first wise man” signal bar. Staining of price bars in accordance with the color of the histogram of the AO indicator. The definition and color allocation of “important” fractal levels located above and below the line of teeth of the Alligator indicator. Identification and marking the “Second Wise Man” and “Blue Light Special” signals.
The indicator determines and marks the following trading signals:
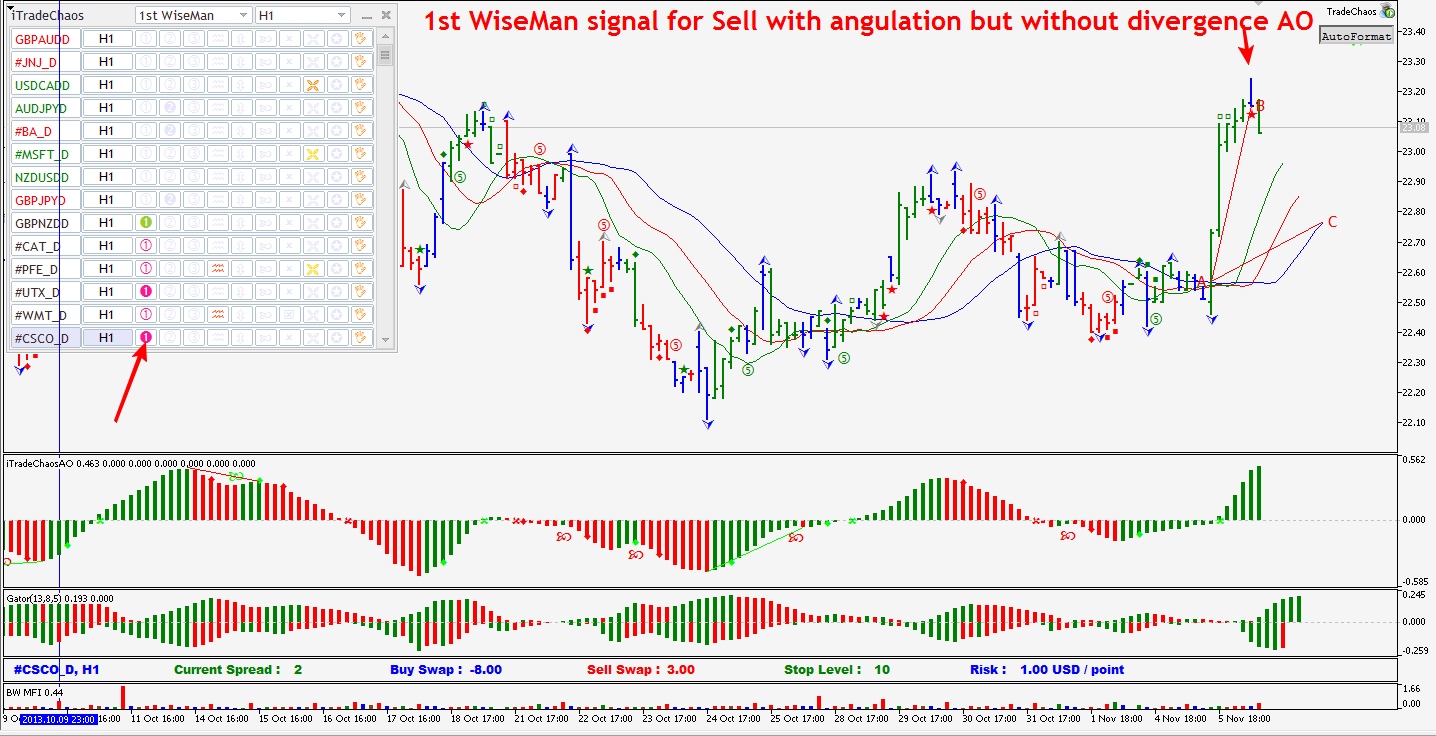
- “The First Wise Man” – a signal of a bullish or bearish divergent (reversing) bar (Pin-Bar). The visualization of the “First Wise Man” on the chart is as follows: stars of different colors. For “bearish reversal bars” – a red star, for “bullish reversal bars” – green. It should be noted that the indicator Trading Chaos Chart (iTradeChaosSE) determines the presence of angulation in bars with signs of reversal. On the points A, B and C, the rays of angulation will be market. This function was invented by me for the first time in the world practice. In accordance with the rules, the “reversal bar” draws rays of angulation. If the angulation is weak, then the lines are dashed, if the angulation is strong, the lines are solid.
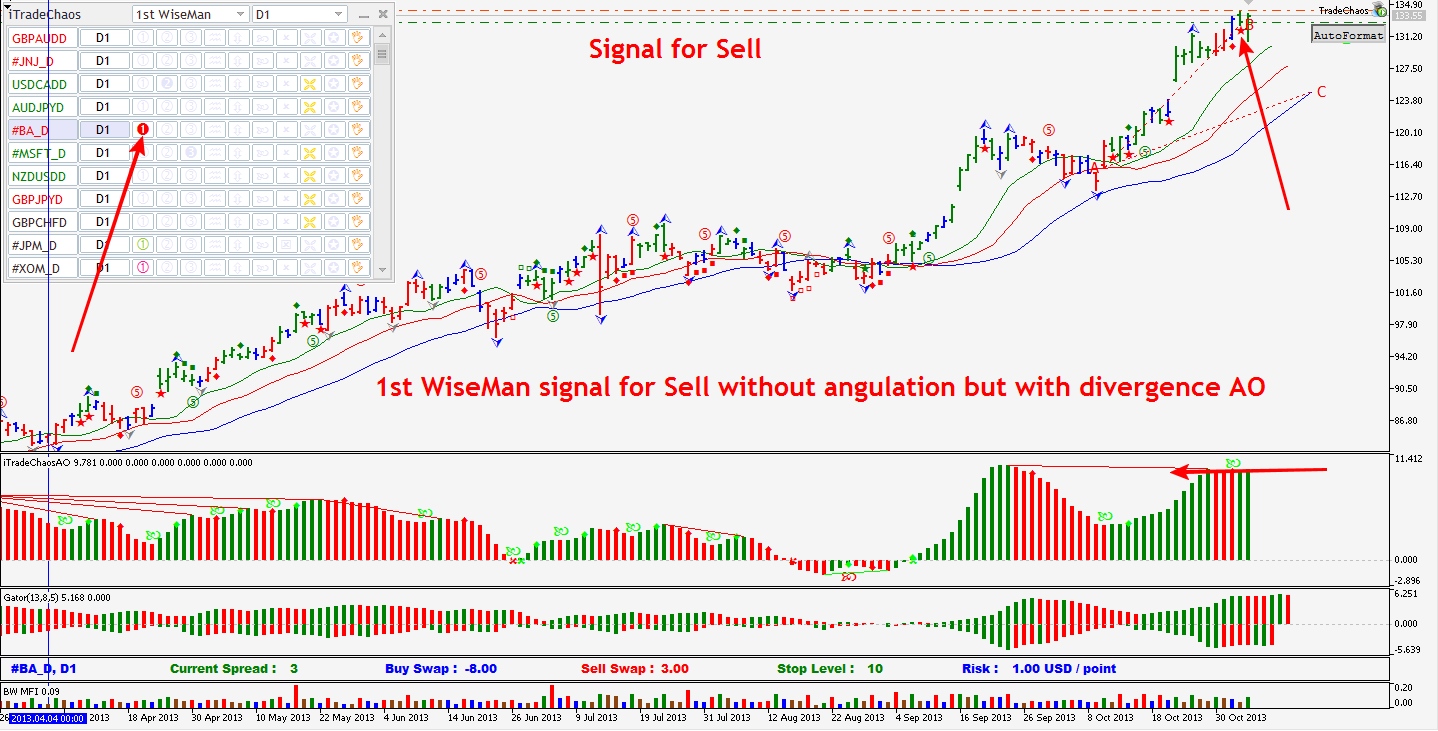
The divergent reversal SQUAT (squat bar) with angulation and divergence at the end of the 5th wave is a very promising signal for entry into the position. All these signals are clearly visible to the trader on the chart.
The following figure is a sell “First Wise man” signal with angulation, but without the divergence on the AO.
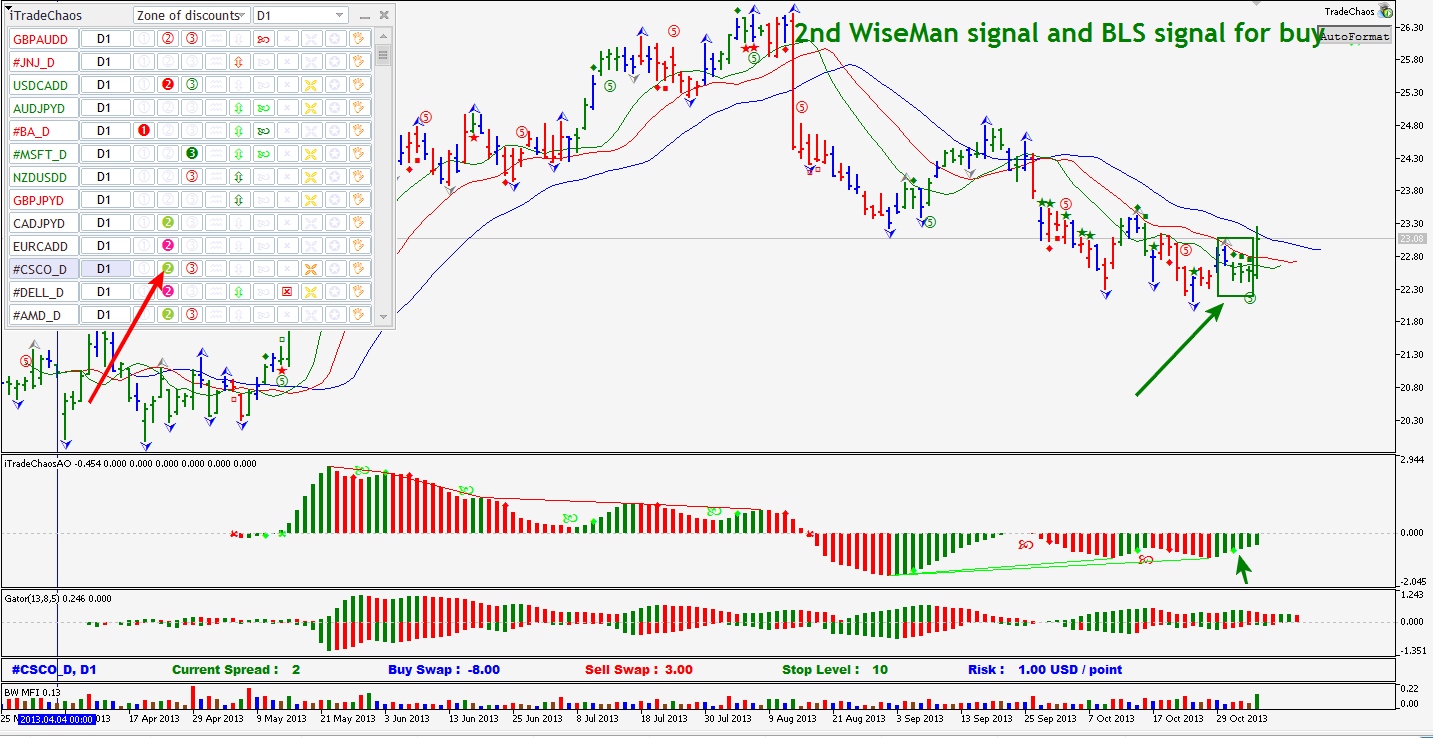
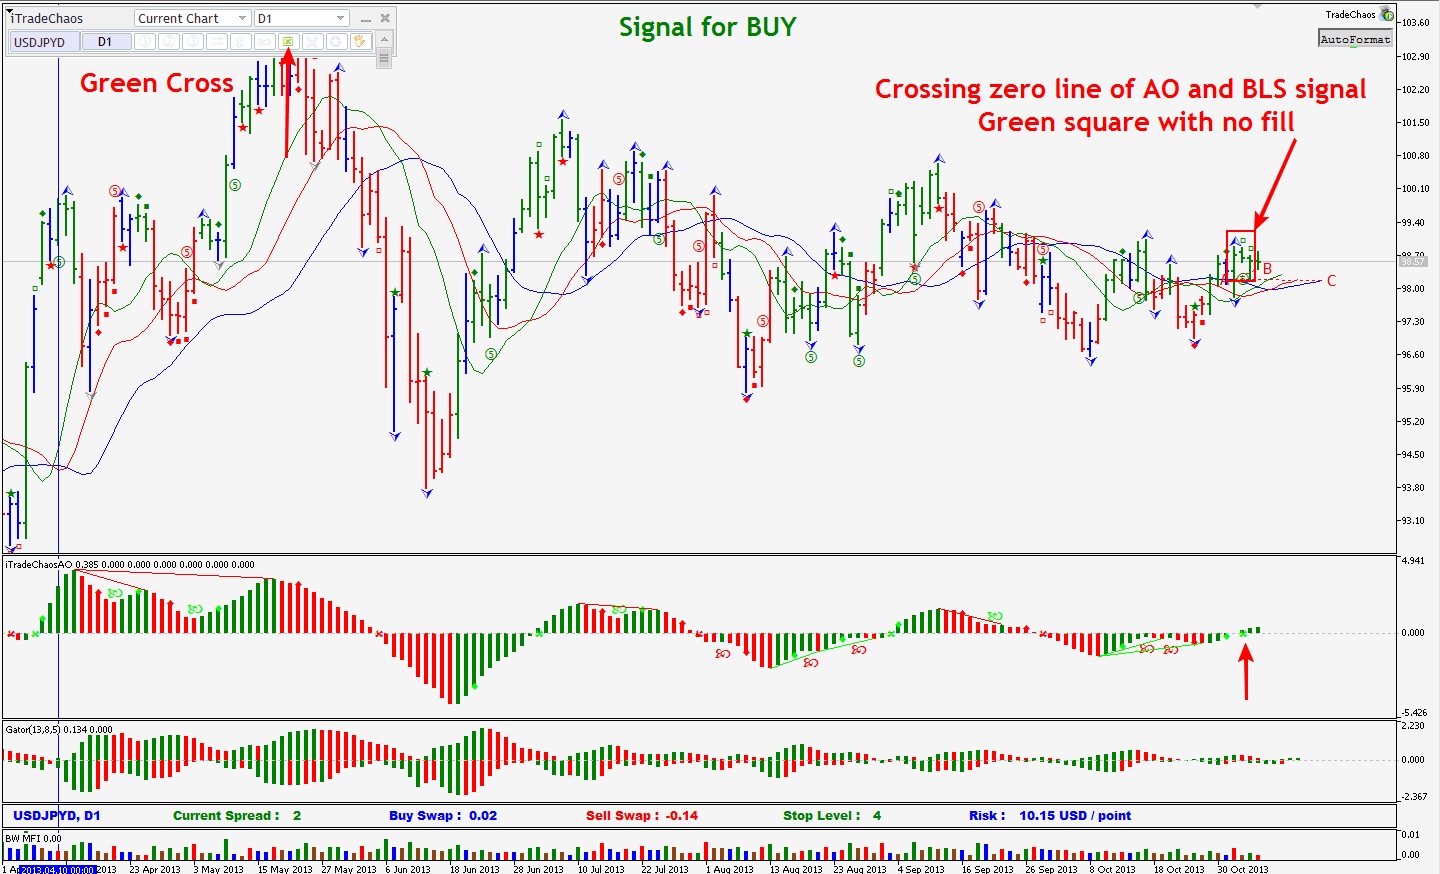
- Signals of the “Second Wise Man” and improved signals “Blue Light Special”, on the transition of the histogram AO through the zero line. Marks – diamonds and squares of green and red colors. The following two figures show such signals.
The first picture – The signal of the “Second wise man” improved to the signal “Blue Light Special”.
The second figure is the Signal of the transition of the histogram AO through the zero line, subsequently improved to “Blue Special Light.”
- “Important fractals” – signals of “The Third Wiseman”. Important fractals are highlighted in blue, usual fractals are gray. SeeFigure.
Autoformat – formes the chart for the required number of 140 bars on it. Since with so many bars, you can correctly make wave counting using the Modified Awesome Oscillator indicator. This indicator can reveal a wave of the older period on waves of lower periods.
ShortTermExtremums – improved signals of local extremums. I called them Push and Revers signals. If the signal is formed within a trend, then it should be considered as a push of prices towards the trend. If the signal is against the trend, then it should be consideres as a reverse signal.
ModifiedBollingerBands – changes the colors of the Bollinger MAs at moments of breakdown volatilities. In the trading panel, this signal is called “Channel Breakout”.
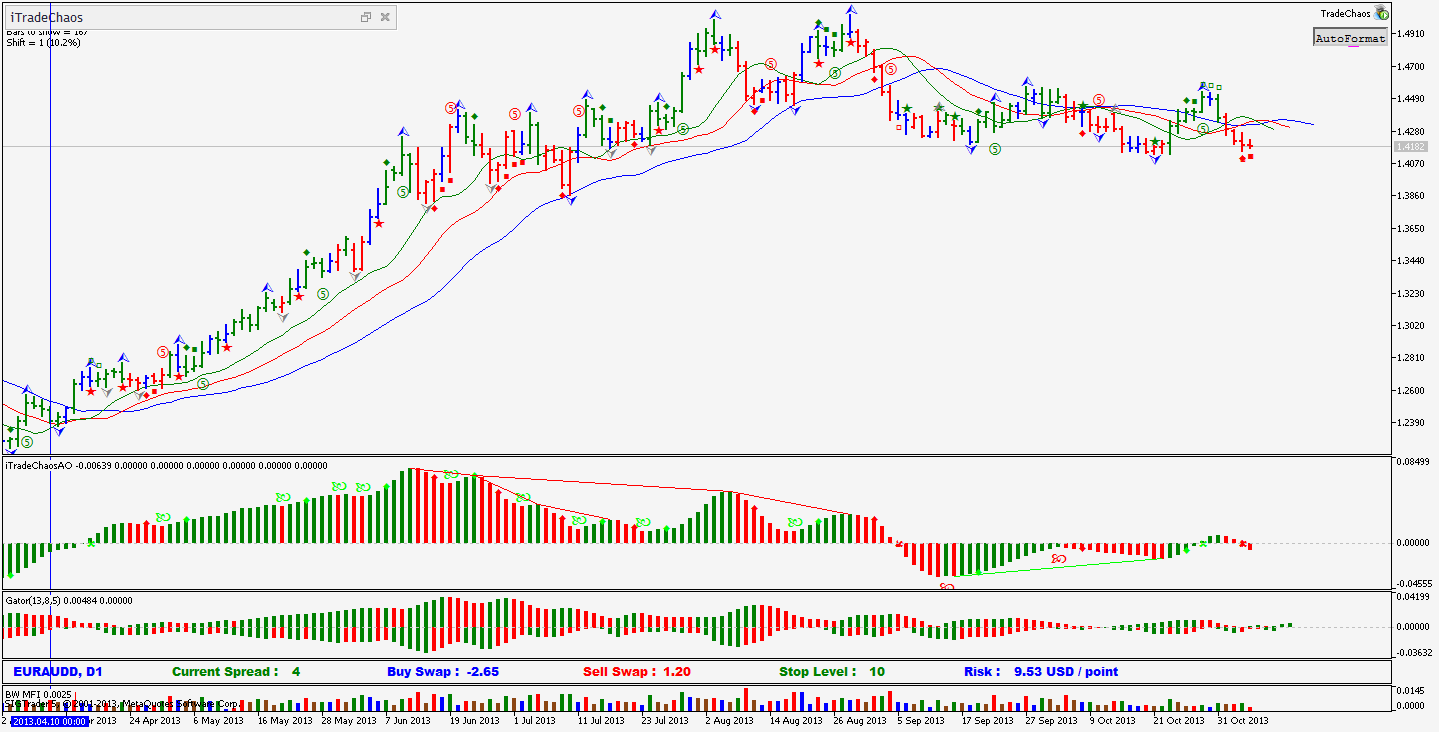
The chart with the indicators mentioned above and saved in the default template will look like this. See the figure.
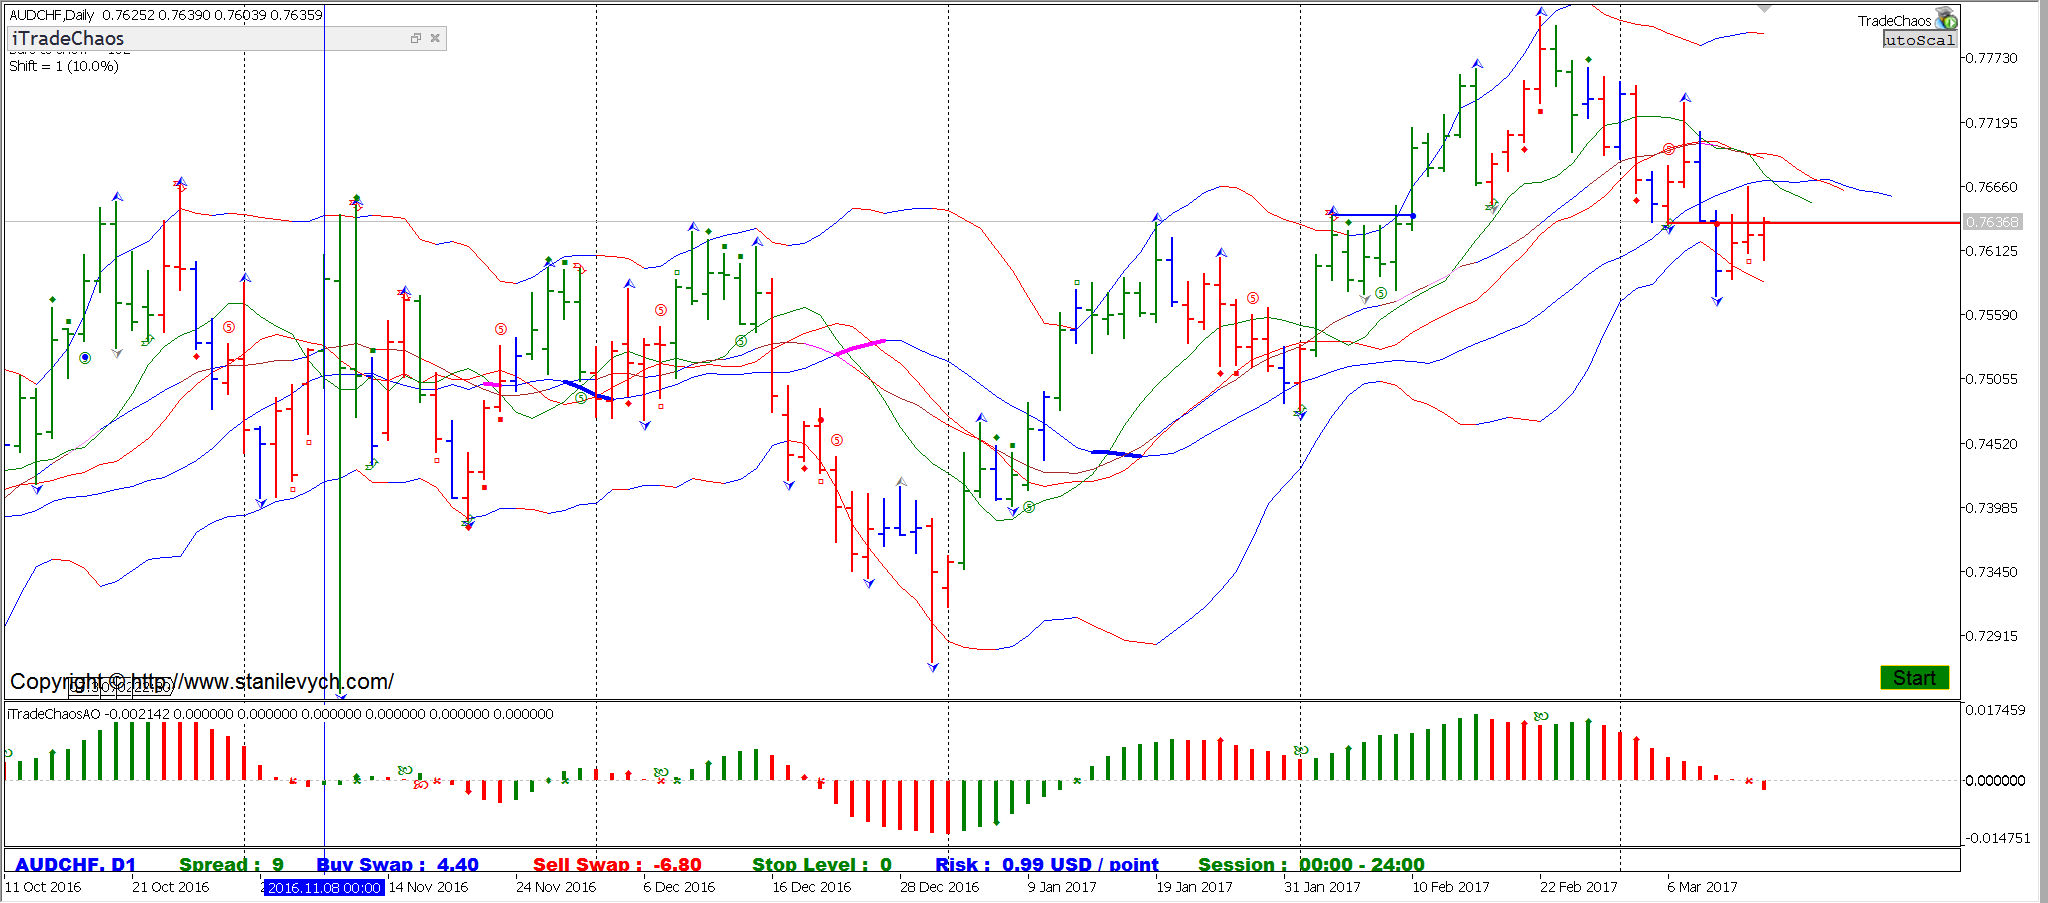
After creating the chart template, turn on the trading panel. On the chart with any trading instrument, press “Hot Keys” Ctrl + 1. The panel will be displayed in the upper left corner of the chart. Within a few seconds, the trading signals that are currently available on the market for all instruments displayed in the Market Watch will be searched. After that, the panel will show an information table with trading signals on the daily range, set by default. We will assume that everything is set up and we can start trading.